max planck institut
informatik
informatik

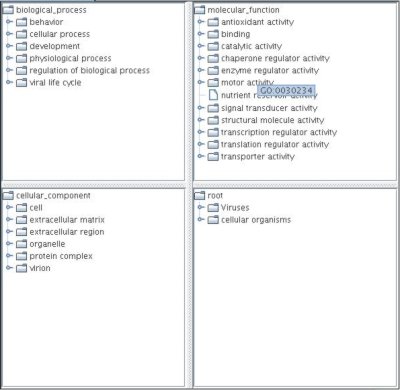
This window is divided into four panes which contain all three ontologies and the taxonomic tree. The panes can be resized by dragging the dividing bar between them. The hits and all possible paths to the root are colored red. A node can be expanded by a single-click and the number in brackets after the name indicates the number of hits in the subtree below this node. After a comparison of sets of GO terms, the terms in the first set are highlighted and their highest similarity to a term in the second set is shown in parentheses after the name. The accession number of the node is displayed in a tooltip and a pop-up menu provides the possibility to access the entity in the online database. An entity can directly be inserted into the query by a double-click. The pop-up menu in the results frame provides the possibility to search for the next occurrence of a hit and to make it visible in the tree window.
|
This visualization is still experimental!
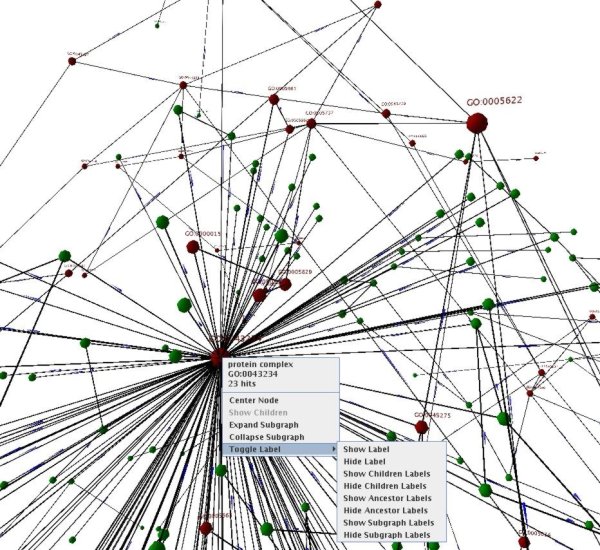
The window shows one ontology or the taxonomic tree. The mouse can be used to rotate, zoom and translate the graph. Holding the left mouse button and moving the mouse rotates the graph view. Moving the mouse back and simultaneously holding the middle mouse button zooms in and moving forth zooms out. Moving the mouse while pressing the right button translates the graph in the view. All hits and their ancestors are colored red as in the 2D view. The size of a node increases with the number of hits in the subgraph of this node. A right-click on a node opens a pop-up menu with several options. First, the node's name, accession number and the number of hits are given. The pop-up menu contains also links to the online database. If two GO term sets are compared, the pop-up menu shows the highest similarity values for each term in the first set. The pop-up menu provides the possibility to center the selected node in the view. It is possible to use several functions to show and hide nodes and their labels. After loading results in the view only the hits, their ancestors and the nodes on the second rank are visible. The "Show children" option makes all children of a node visible. If this option is greyed out, all children are already visible. The "Expand subgraph" button makes all nodes in the subgraph rooted at the selected node visible. "Collapse subgraph" hides all descendants of the selected node. It is possible to toggle the label of a selected node, the children's labels, the ancestor's labels and the descendant's labels with the options in the "Toggle Label" submenu. Hiding uninteresting parts of the graph and labels improves the performance of this view tremendously. A right-click on an edge pops up a menu with the options to center the edge's start node and end node. This allows to quickly browse the hierarchy.
|
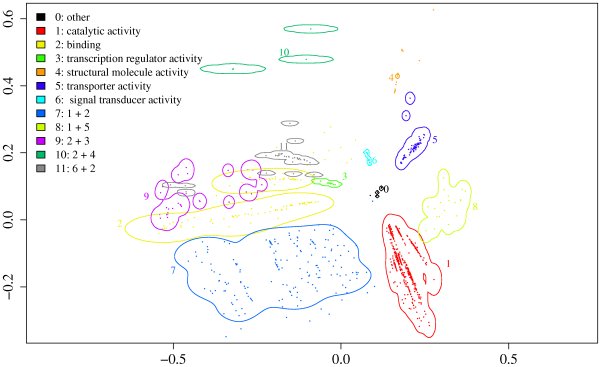
This window shows a map of the functional space of Pfam families. First, the MFscores between all Pfam families that are annotated with molecular function terms have been computed. The resulting matrix was used as input for a multidimensional scaling in order to retrieve a two-dimensional map. The resulting map shows custers with families annotated with different molecular functions. We used the corresponding first level term for naming the clusters.
|